Mysteries of Space!
A dive into black holes and the amazing science behind them
Meghan Chrissakis and Ben Farr
Transcript
Overview
A digitally drawn, cartoony comic.
Cover
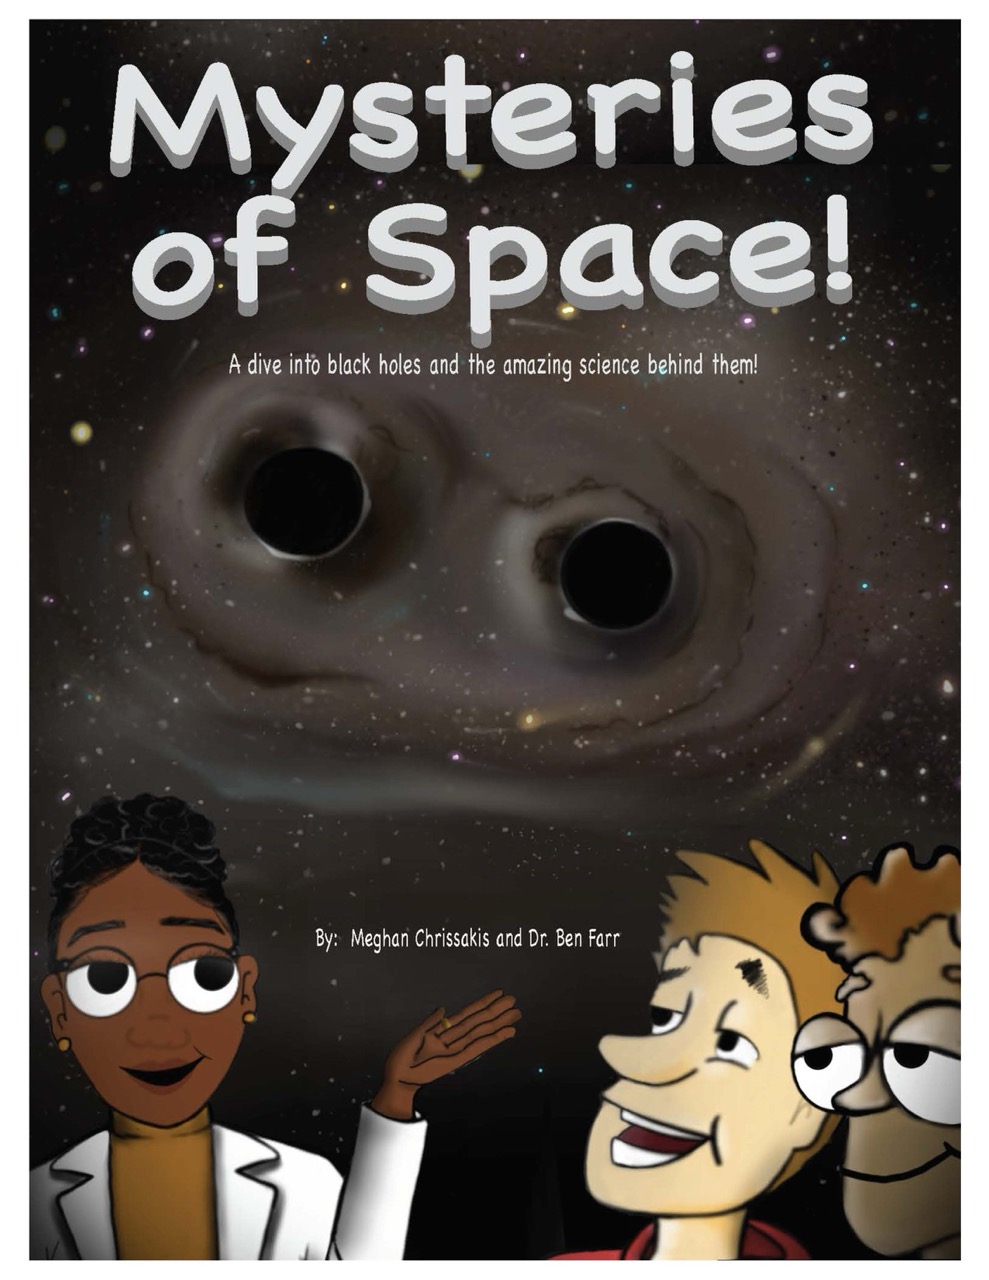
Title: Mysteries of Space! A dive into black holes and the amazing science behind them!
By Meghan Chrissakis and Dr. Ben Farr
Cover description: The night sky with two black holes. At the bottom of the page a scientist and two students talk to each other.
Page 1
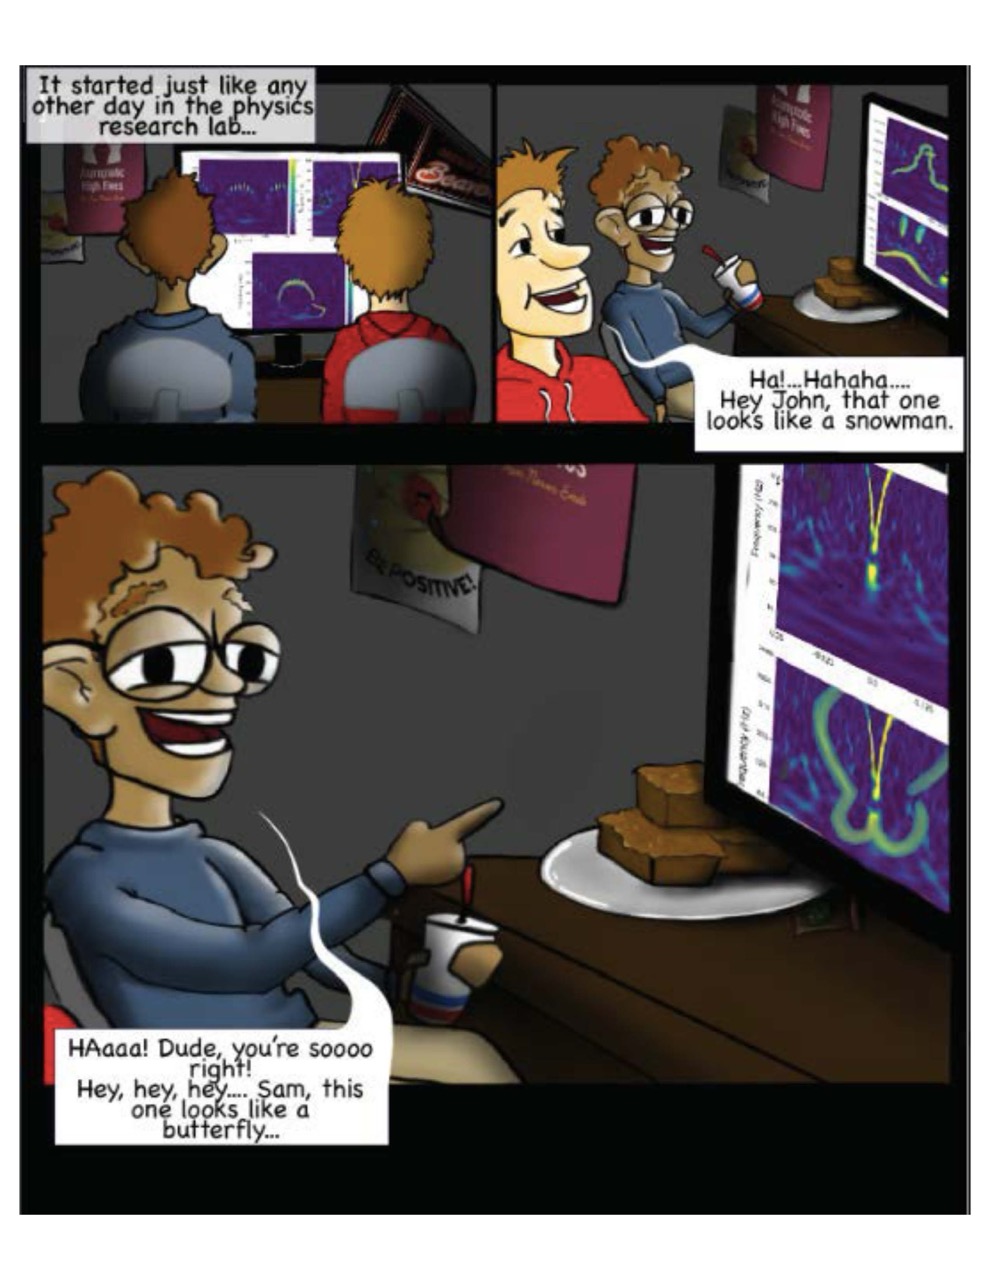
Panel 1: “It started just like any other day in the physics research lab…” Two students sit in a darkened room looking at charts on a computer. The charts are blue, with multicolored yellow outlines showing areas of higher energy.
Panel 2: “Ha!…Hahaha…Hey John, that one looks like a snowman.” The students look at a snowman shaped chart.
Panel 3: “Haaaa! Dude, you’re sooo right! Hey, hey, hey…Sam, this one looks like a butterfly…” Sam is a white man in a hoodie, John is a Black man in a sweater. John points at a butterfly graph, laughing.
Page 2
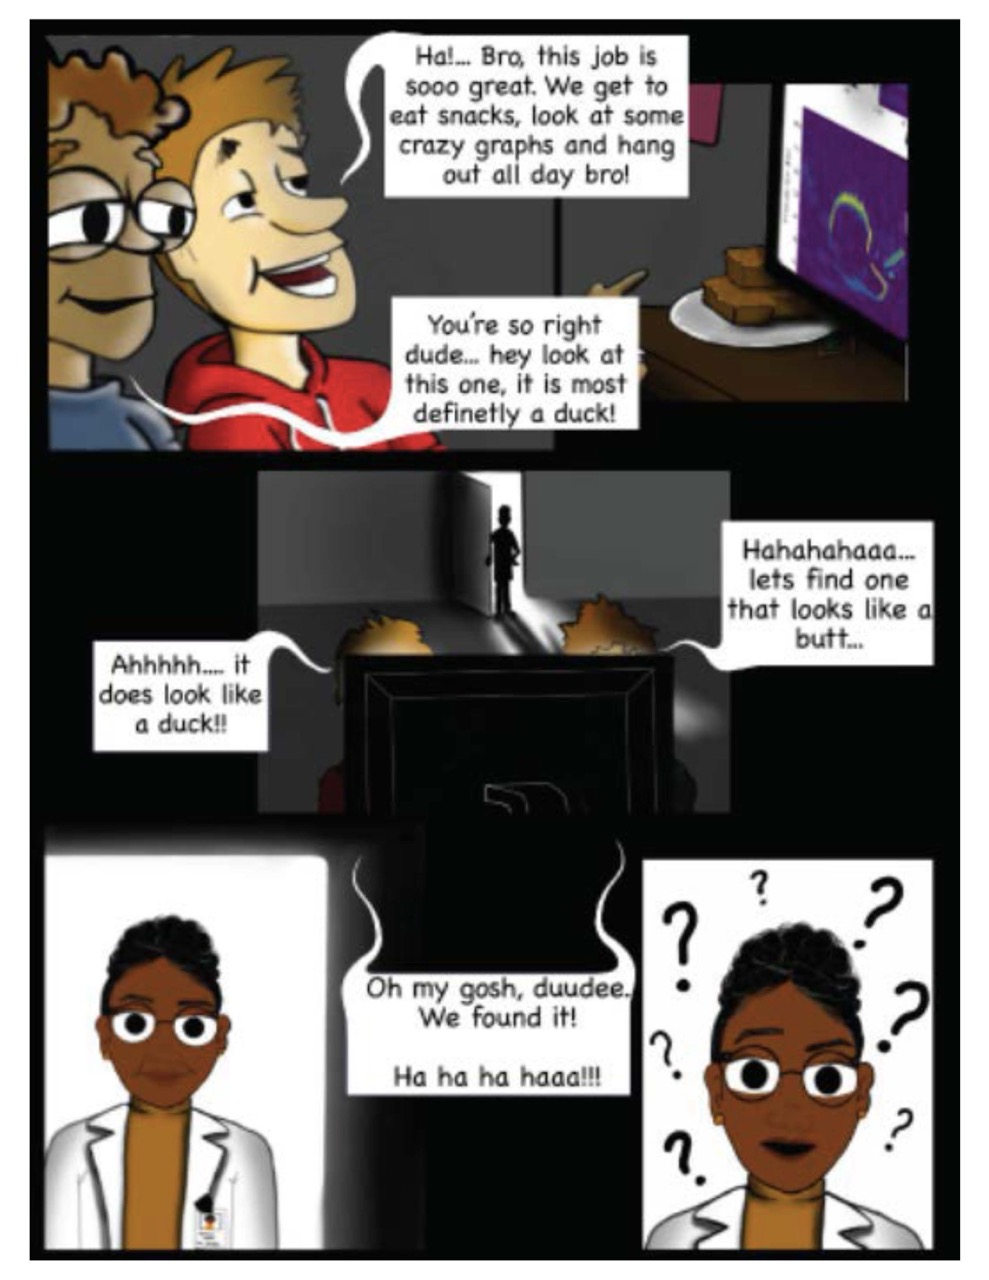
Panel 1: “Ha!… Bro, this job is sooo great. We get to eat snacks, look at some crazy graphs and hang out all day bro!” “You’re so right dude… hey look at this one, it is most definitely a duck!”
Panel 2: We see the back of the computer monitor and the tops of the students’ heads. Behind them, the door is open. A person is silhouetted in the doorway. The researchers continue talking: “Ahhhhh… it does look like a duck!!” “Hahahahaaa… let’s find one that looks like a butt…”
Panel 3: A close up on the scientist who opened the door. She’s a middle-aged Black woman in a lab coat wearing glasses.
Panel 4: “Oh my gosh, duudee. We found it! Ha ha ha haaa!!!”
Panel 5: The scientist raises her eyebrow skeptically.
Page 3
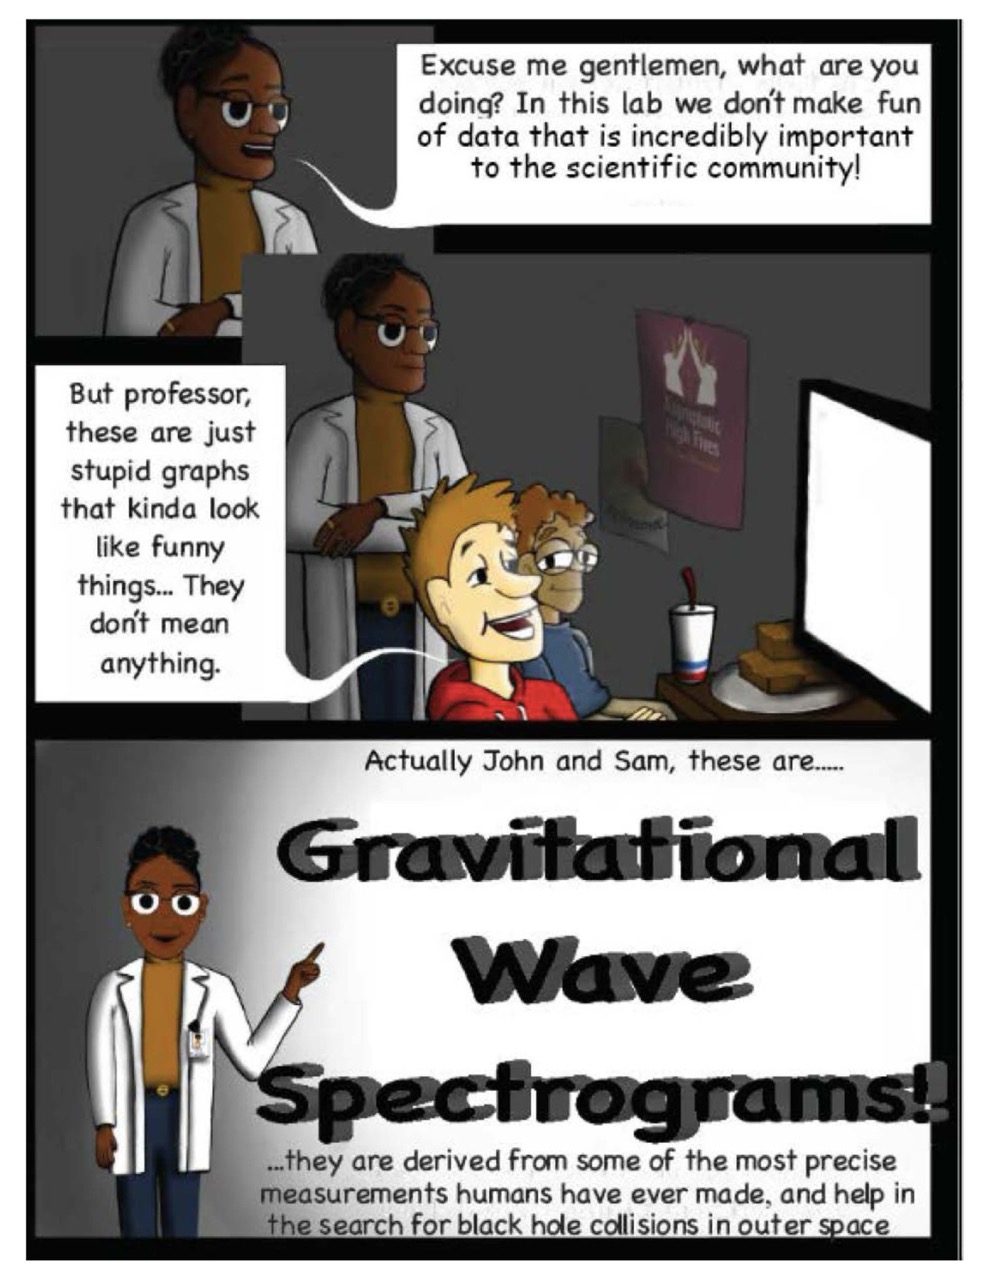
Panel 1: The scientist looks over the students’ shoulder, “Excuse me gentlemen, what are you doing? In this lab we don’t make fun of data that is incredibly important to the scientific community!”
Panel 2: Sam: “But professor, these are just stupid graphs that kinda look like funny things… They don’t mean anything.”
Panel 3: The scientist: “Actually John and Sam, these are…Gravitational Wave Spectrograms! They are derived from some of the most precise measurements humans have ever made, and help in the search for black hole collisions in outer space.”
Page 4
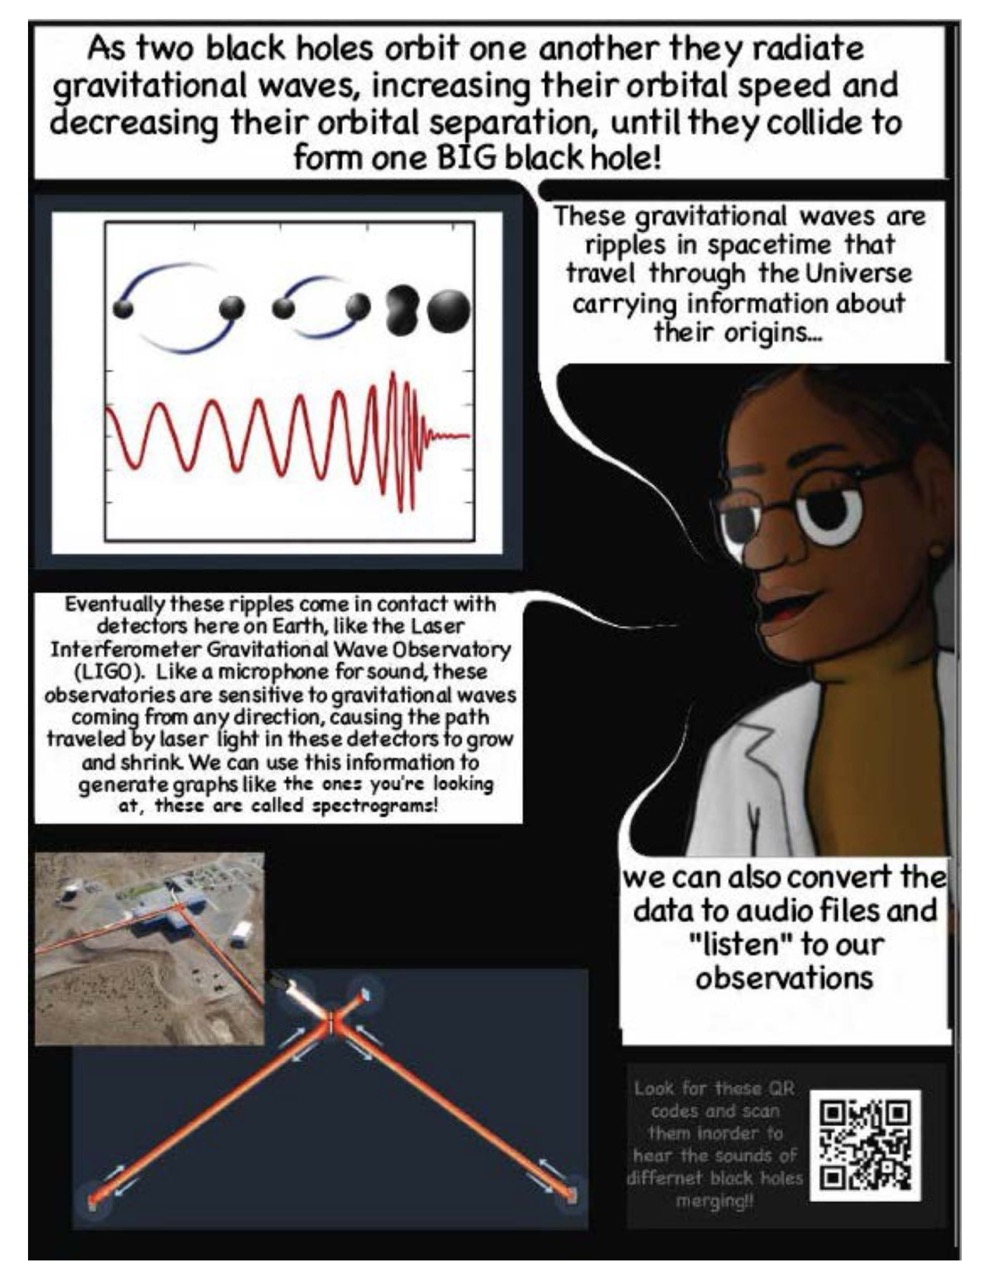
“As two black holes orbit one another they radiate gravitational waves, increasing their orbital speed and decreasing their orbital separation, until they collide to form one BIG black hole! These gravitational waves are ripples in spacetime that travel through the Universe carrying information about their origins…”
A chart shows black holes circling and eventually merging. As they get closer together a sine wave gets more compressed and taller.
“Eventually these ripples come in contact with detectors here on Earth, like the Laser Interferometer Gravitational Wave Observatory (LIGO). Like a microphone for sound, these observatories are sensitive to gravitational waves coming from any direction, causing the path traveled by laser light in these detectors to grow and shrink. We can use this information to generate graphs like the ones you’re looking at, these are called spectrograms! We can also convert the data to audio files and ‘listen’ to our observations.”
Aerial view of LIGO Hanford, a building in a large dirt field with two long tubes coming out of the south and the west sides of the building, where the laser detectors are housed.
Page 5
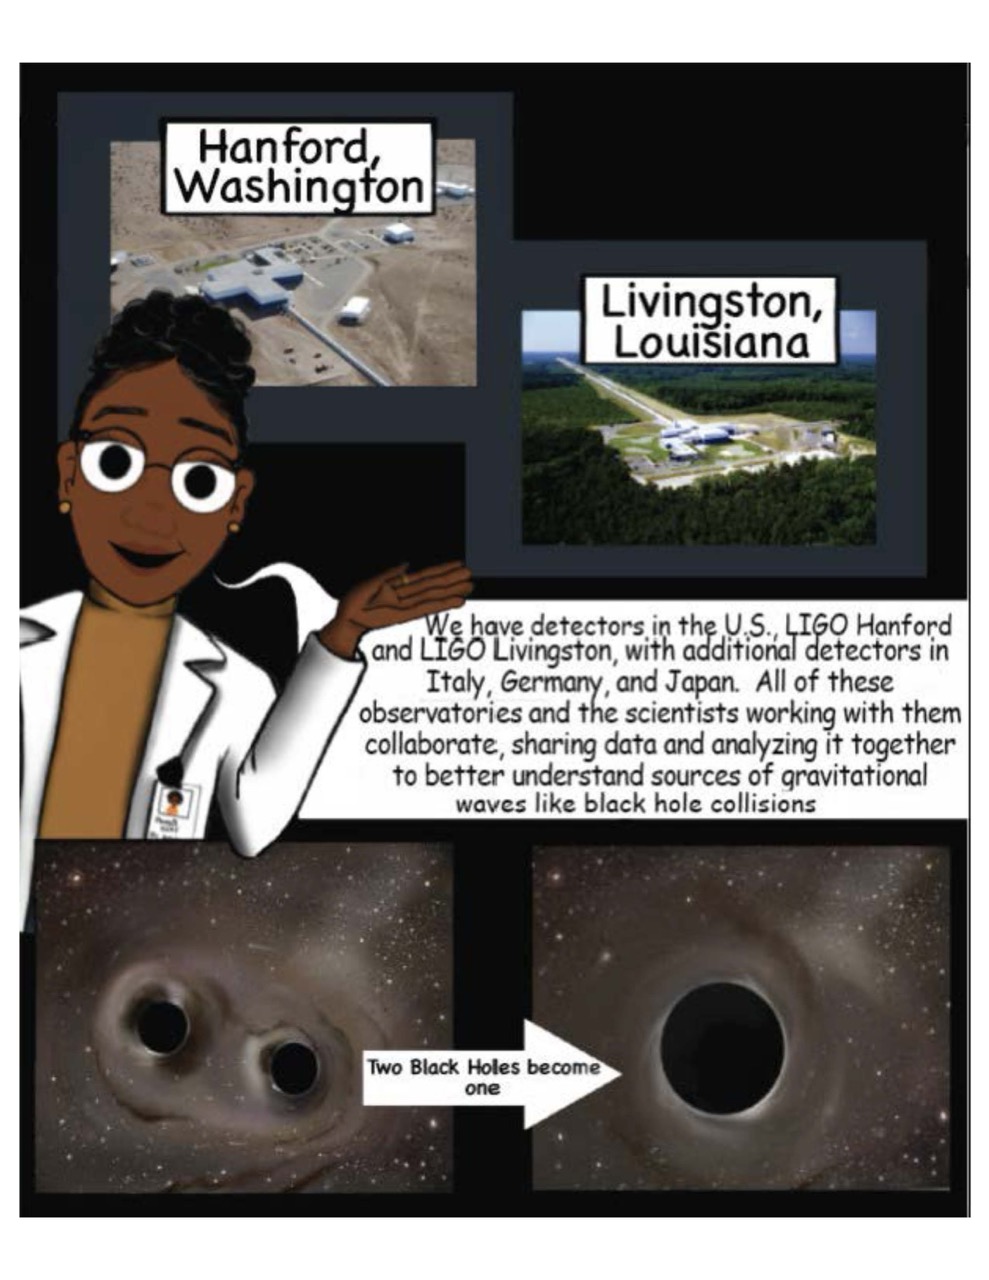
Panel 1: “Hanford, Washington” The same building from the previous page.
Panel 2: “Livingston, Louisiana” An aerial shot of a long laser tunnel in a forested area.
Panel 3: The scientist: “We have detectors in the U.S., LIGO Hanford and LIGO Livingston, with additional detectors in Italy, Germany, and Japan. All of these observatories and scientists working with them collaborate, sharing data and analyzing it together to better understand sources of gravitational waves like black hole collisions.”
Panel 4 and 5: “Two black holes become one” An arrow points from a panel with two black holes circling each other to another panel where they’ve merged into one larger black hole.”
Page 6
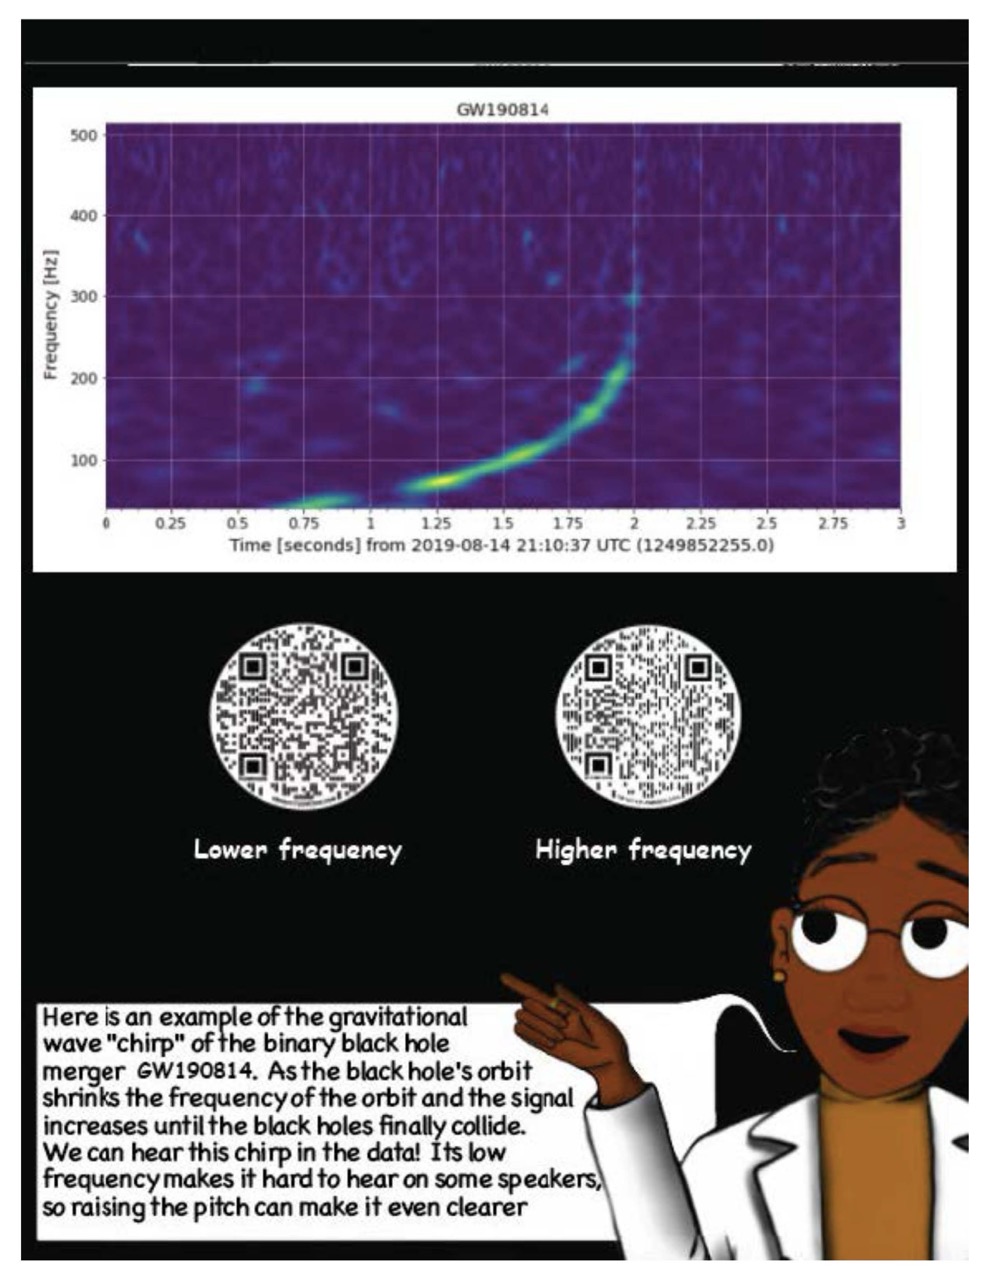
Panel 1: A gravitational wave spectrogram titled “GW190814” with frequency in Hz on the y axis and time in seconds on the x axis, from 2019-08-14. There is a bright line starting at 0.5 seconds that increases exponentially.
QR codes link to two audio clips: Lower frequency and higher frequency.
Panel 2: The scientist: “Here is an example of the gravitational wave “chirp” of the binary black hold merger GW190814. As the black hole’s orbit shrinks the frequency of the orbit and the signal increases until the black holes finally collide. We can hear this chirp in the data! Its low frequency makes it hard to hear on some speakers, so raising the pitch can make it even clearer.”
Page 7
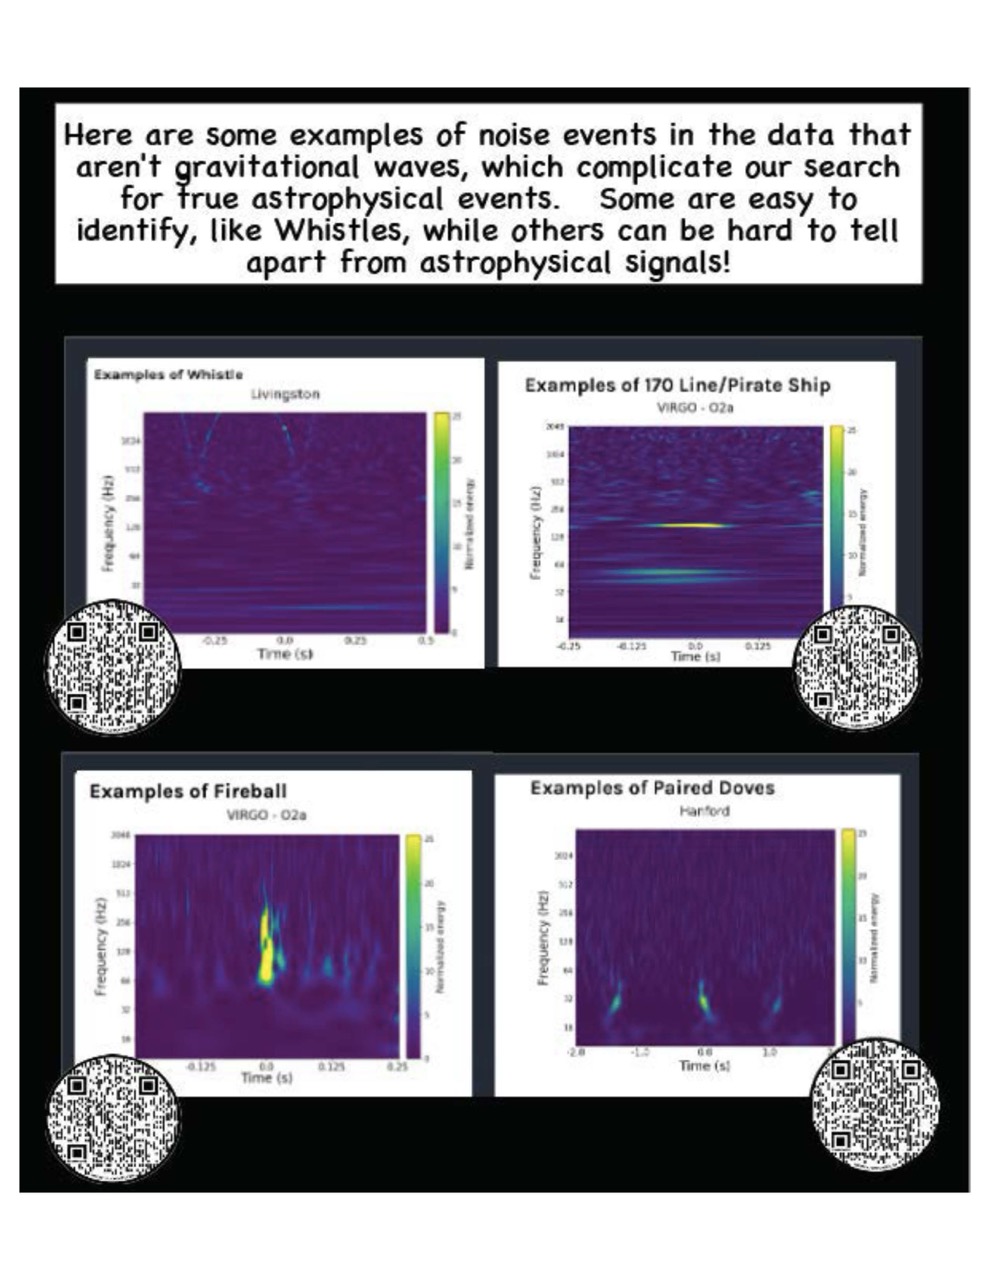
“Here are some examples of noise events in the data that aren’t gravitational waves, which complicate our search for true astrophysical events. Some are easy to identify, like whistles, while others can be hard to tell apart from astrophysical signals!”
4 similar gravitational wave spectrograms, each with a QR code link.
Chart 1: Examples of Whistle, Livingston.
Chart 3: Examples of Fireball, VIRGO – O2a
Chart 4: Examples of Paired Doves, Hanford
Page 8
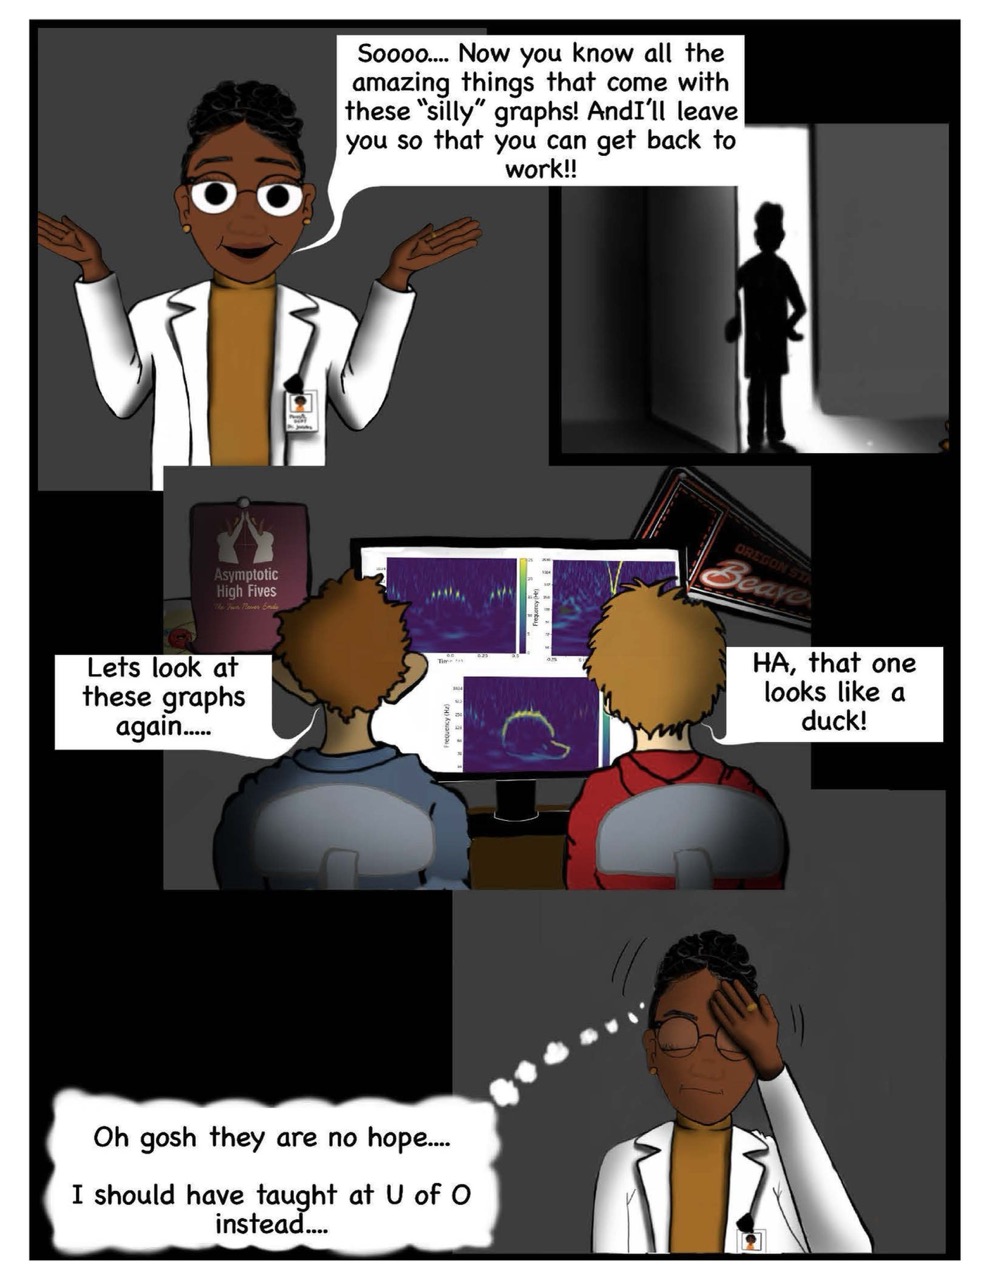
Panel 1: Scientist: “Soooo… Now you know all the amazing things that come with these “silly” graphs! And I’ll leave you so that you can get back to work!!”
Panel 2: The scientist stands in the door to the lab, backlit.
Panel 3: Sam and John look at the charts on their monitor. John: “Lets look at these graphs again…..” Sam: “Ha, that one looks like a duck!”
Panel 4: The scientist face palms, thinking: “Oh gosh they are no hope…. I should have taught at U of O instead….”
